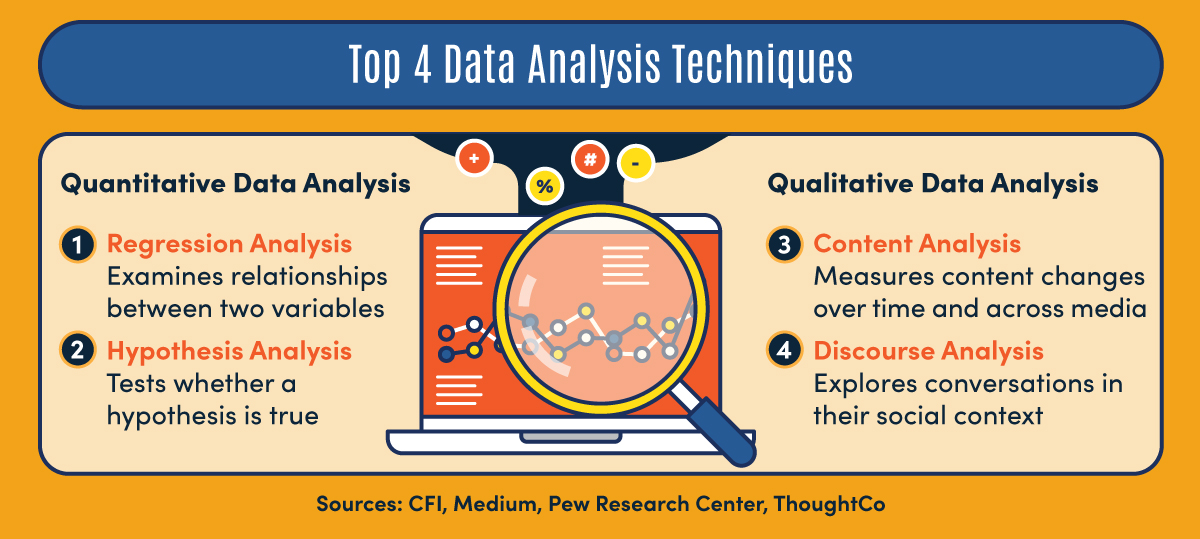
Data analysis is both an art and a science. It involves the use of statistical methods, programming, and visualization tools to make sense of complex data sets. In this article, we'll explore the different approaches to data analysis and best practices for getting the most out of your data.
The Art of Data Analysis
Data analysis is an art because it involves making subjective decisions about how to analyze and interpret data. Some of the key aspects of the art of data analysis include:
- Asking the Right Questions
One of the most important aspects of data analysis is asking the right questions. This involves understanding the problem you are trying to solve and identifying the key variables that are relevant to that problem. By asking the right questions, you can ensure that your data analysis is focused and relevant.
- Choosing the Right Methods
There are many different statistical methods that can be used for data analysis. Choosing the right method depends on the type of data you have and the questions you are trying to answer. This requires a deep understanding of statistical theory and an ability to apply that theory to real-world data sets.
- Interpreting Results
Data analysis is not just about running statistical tests and generating charts and graphs. It is also about interpreting the results of those tests and using them to make decisions. This requires an ability to think critically and creatively about the data and its implications.
The Science of Data Analysis
Data analysis is also a science because it involves using rigorous methods to analyze and interpret data. Some of the key aspects of the science of data analysis include:
- Data Collection and Preparation
Data analysis begins with data collection and preparation. This involves identifying the data you need, collecting that data, and cleaning and organizing it so that it can be analyzed effectively. This requires a deep understanding of data structures and the ability to work with large and complex data sets.
- Statistical Analysis
Statistical analysis is the heart of data analysis. It involves using statistical methods to analyze data and test hypotheses. This requires a deep understanding of statistical theory and the ability to apply that theory to real-world data sets.
- Data Visualization
Data visualization is an important part of data analysis because it allows you to communicate complex information in a clear and concise way. This requires an ability to use visualization tools effectively and to design charts and graphs that are both informative and visually appealing.
Best Practices for Data Analysis
There are many best practices for data analysis that can help you get the most out of your data:
- Have a Clear Question or Hypothesis
Data analysis should always begin with a clear question or hypothesis. This ensures that your analysis is focused and relevant.
- Use Multiple Methods
Data analysis is not a one-size-fits-all process. It often requires multiple methods to be used in order to fully understand the data. This requires an ability to think creatively about the data and to use a range of statistical methods and visualization tools.
- Validate Your Results
Data analysis can be prone to errors, so it's important to validate your results. This involves checking your data for accuracy and running sensitivity analyses to ensure that your results are robust.
- Communicate Your Results Effectively
Data analysis is only useful if you can communicate your results effectively. This requires an ability to use visualization tools effectively and to design charts and graphs that are both informative and visually appealing.
Conclusion
Data analysis is both an art and a science. It involves making subjective decisions about how to analyze and interpret data, while also using rigorous methods to analyze and interpret that data. By following best practices and using a range of statistical methods and visualization tools, you can get the most out of your data and make informed decisions that drive success.