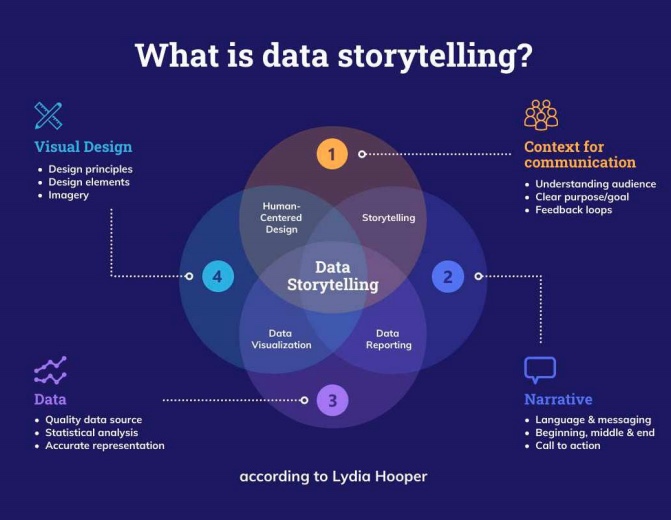
Data visualization is the process of representing data in a visual format to communicate complex information in a clear and concise way. It is an essential tool for businesses to gain insights into their operations and communicate those insights effectively. In this article, we'll explore the importance of data visualization in communicating insights through visual storytelling.
Why Data Visualization Matters
Data visualization is important because it enables businesses to communicate insights in a way that is easy to understand and visually appealing. Here are some of the key benefits of data visualization:
- Clarity
Data visualization can make complex information easier to understand by presenting it in a clear and concise way. By using charts, graphs, and other visual representations, businesses can communicate insights more effectively.
- Memorability
Data visualization can also make information more memorable by presenting it in a visually appealing way. This can help businesses to communicate key insights more effectively and ensure that they are remembered by stakeholders.
- Speed
Data visualization can help businesses to communicate insights more quickly and efficiently than other methods. By presenting information visually, stakeholders can quickly understand key insights and take action as needed.
The Art of Visual Storytelling
Data visualization is not just about presenting data in a clear and concise way. It is also about telling a story through visual means. Here are some of the key aspects of visual storytelling:
- Narrative
Visual storytelling involves creating a narrative around the data being presented. This can involve identifying key insights and presenting them in a way that tells a story and engages stakeholders.
- Emotion
Visual storytelling can also involve creating an emotional connection with stakeholders by presenting data in a way that resonates with them. This can involve using colors, images, and other visual elements to create an emotional response.
- Context
Visual storytelling also involves providing context for the data being presented. This can involve providing background information about the data and explaining how it fits into the larger picture.
Best Practices for Data Visualization
There are many best practices that businesses can follow to ensure that their data visualizations are effective and engaging:
- Know Your Audience
It is important to understand your audience and what they are looking for in a data visualization. This can help you to create a visualization that is engaging and relevant to their needs.
- Keep it Simple
Data visualizations should be simple and easy to understand. Avoid cluttering the visualization with unnecessary information or visual elements.
- Use the Right Visualizations
It is important to choose the right visualizations for the data being presented. Different types of data require different types of visualizations, so it is important to choose the right one for the job.
- Use Color Effectively
Color can be used effectively in data visualizations to create an emotional connection with stakeholders and highlight key insights. However, it is important to use color sparingly and effectively.
Conclusion
Data visualization is an essential tool for businesses to gain insights into their operations and communicate those insights effectively. By using visual storytelling techniques, businesses can create engaging and compelling visualizations that communicate key insights in a clear and concise way. By following best practices for data visualization, businesses can ensure that their visualizations are effective and engaging, helping them to drive growth and success.